How to Make Better Predictions: A Practical Guide
Learn how to make better predictions with practical habits: base rates, probabilities, calibration, updating, the Brier score and what superforecasters do.

In short
To make better predictions, start from the base rate, state your answer as a probability, update in small steps when new evidence arrives, and score yourself afterwards with a measure such as the Brier score. Research on superforecasters suggests these habits can be learned and measured.
Almost everyone makes predictions all day. Will the train be late? Will the launch slip? Will my team win on Saturday? The odd thing is that almost nobody checks how those predictions turn out, so most of us never find out whether we are any good.
Good news: forecasting is a skill, and skills can be trained. This guide covers the practical habits that research and experienced forecasters keep coming back to: starting from base rates, thinking in probabilities, calibration, updating on news, keeping score with the Brier score, and what Philip Tetlock's superforecasters do differently. Each section is self-contained, so jump to the one you need. It won't make you an oracle (nobody is), but it should make your predictions measurably better.
Can You Really Get Better at Predicting?
Let's start with the discouraging part, because it explains why the habits below matter.
In Expert Political Judgment (2005), the psychologist Philip Tetlock tracked thousands of predictions from political experts and found that, on average, they did only slightly better than simple baselines. Confidence, it turned out, was not a reliable sign of accuracy, and experts were rarely held accountable when they were wrong.
Then came the encouraging part. From 2011, the US intelligence research agency IARPA ran a forecasting tournament, and Tetlock, Barbara Mellers, and Don Moore's Good Judgment Project entered a team of volunteers. Its forecasts were the best two years in a row. The top 2% of each year's forecasters, nicknamed superforecasters, consistently outperformed their peers on geopolitical questions.
Mellers and colleagues reported in Psychological Science that three things improved accuracy: training, teaming, and tracking the best performers. The broad lesson is that forecasters who think in probabilities, stay open-minded, and check their results tend to do better. Tetlock and the journalist Dan Gardner wrote the story up for general readers in Superforecasting (2015).
Why Start With the Base Rate?
A base rate is how often something happens across similar past cases. It is your starting point before you look at anything specific.
Suppose your friend says their startup will launch by March. Your gut reacts to the pitch: smart team, clear plan, lots of energy. The base-rate question is different: of the projects like this that you have seen, how many shipped on time? If the answer is "about one in four," then 25% is where you begin, not 90%.
After that, you adjust for what's special about this case. Maybe the team has already finished the hard part. Maybe the date depends on a supplier who has always been late. The order matters, though. Start with the outside view (what usually happens), then move with the inside view (what's different here). Most people do it backwards, and the story about the specific case drowns out the statistics.
A simple routine:
- Name the reference class: what kind of thing is this an example of?
- Find or estimate how often that kind of thing happens.
- Write down that number before reading anything else.
- Adjust up or down for the specific details, and say why.
How Do You Think in Probabilities Instead of Yes or No?
"Probably," "likely," and "no chance" mean different things to different people. In a 1951 intelligence estimate, the phrase "serious possibility" was read by different analysts as anything from about 20% to 80%, as the CIA analyst Sherman Kent later recounted in his essay "Words of Estimative Probability." A number is harder to misread.
So give your answer as a percentage. "The team will win" becomes "I think there's a 65% chance." That small shift has three benefits:
- It exposes how confident you really are, to yourself as much as anyone
- It lets you compare your view with a market price or a friend's number
- It can be scored later, which words like 'probably' can't
A few rules of thumb help. Avoid 0% and 100% unless the event is truly impossible or certain; they can't be improved by new evidence. Use 50% only when you really have no lean, not as a way to dodge the question. And remember that a probability of 65% means you expect to be wrong about a third of the time, which is not a failure.
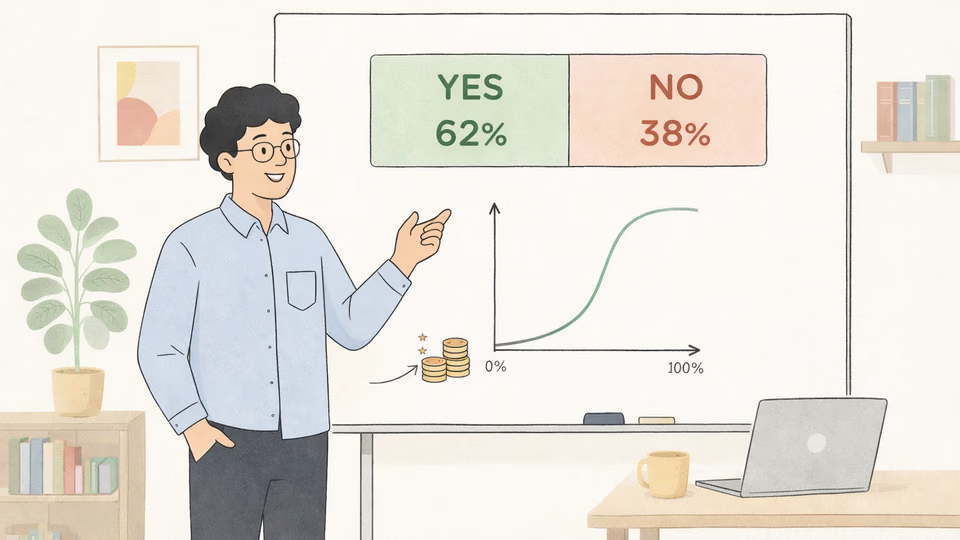
If prices and probabilities feel slippery, how a market price turns into a probability shows that a price of 0.65 Coins and a 65% chance are the same thing written two ways.
What Does It Mean to Be Well Calibrated?
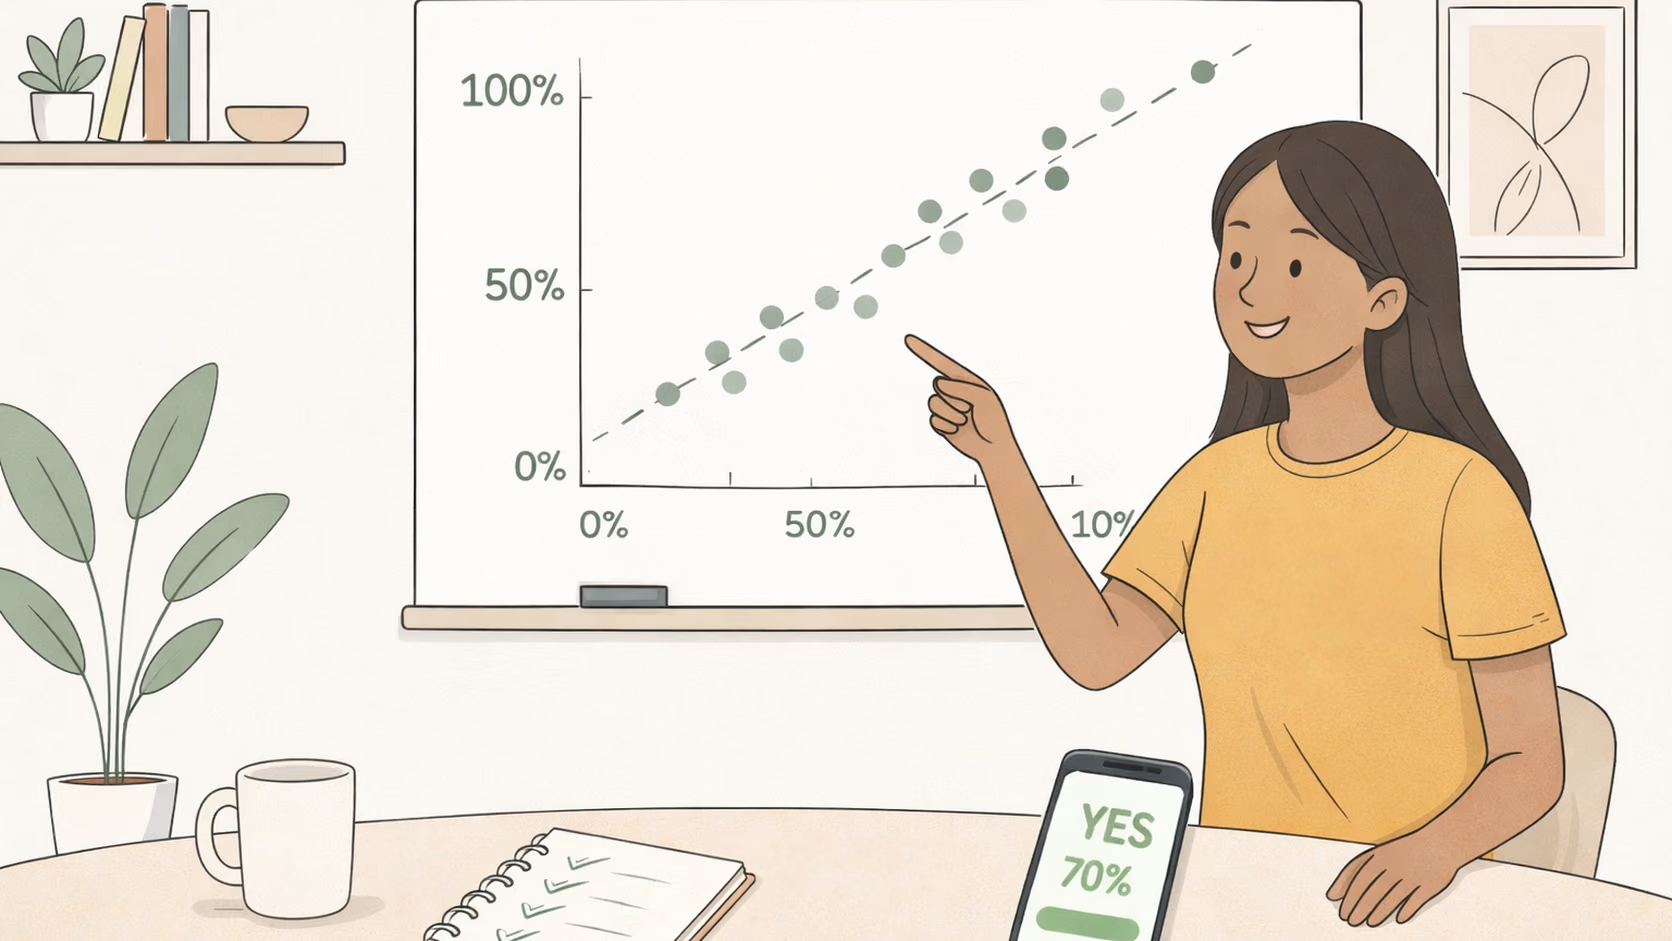
You are well calibrated when your probabilities match reality in the long run. Of all the things you call 70% likely, roughly 70% should happen. Of the 90% ones, about 90%.
Calibration needs many predictions, which is why one result tells you almost nothing. If you said 80% and it didn't happen, you weren't necessarily wrong; 20% events happen one time in five. What matters is the pattern.
Here's how it might look after 40 predictions grouped into buckets:
| You said | Predictions | Happened | Verdict |
|---|---|---|---|
| About 90% | 10 | 7 (70%) | Overconfident |
| About 70% | 20 | 14 (70%) | Well calibrated |
| About 30% | 10 | 5 (50%) | Underconfident about unlikely events |
That's a made-up example, but a common shape: most people discover that their 90% calls aren't really 90%. The fix isn't to stop being confident. It's to reserve high numbers for things that have earned them.
On KrowdCall you don't have to keep the tally yourself: the calibration section of your profile and P&L builds this kind of chart from the prices you actually paid. How the calibration score works explains how to read it, and why your first few markets don't say much yet.
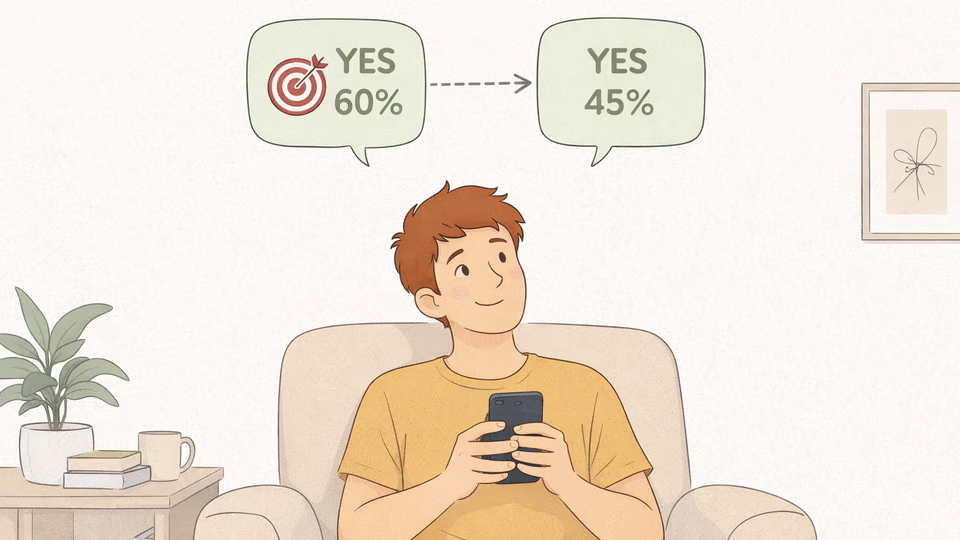
How Should You Update When New Information Arrives?
Forecasts are not tattoos. Superforecasters are known for changing their numbers frequently and in small steps, as evidence comes in.
Take a question: "Will our office move to the new building before June?" You start at 30% because moves like this usually slip. Then three things happen.
| News | Strength of evidence | New forecast |
|---|---|---|
| The lease is signed | Strong, a prerequisite is done | 45% |
| A rumor that the builders are behind | Weak, secondhand | 42% |
| The builders confirm the handover date in April | Strong | 65% |
Two mistakes to avoid. Overreacting means jumping from 30% to 90% on one headline. Underreacting means ignoring a signed lease because your first number felt settled. The rule is proportionality: strong, direct, reliable evidence earns a big move, weak or secondhand evidence earns a nudge.
It also helps to ask, before reading the news, "What would change my mind?" If nothing could, your number isn't a forecast, it is a belief.
You can see this live in a market. When a good piece of news lands, the probability moves, and how to tell whether a price move is an overreaction explains how to judge it.
What Is the Brier Score and How Do You Use It?
The Brier score is a way to grade probability forecasts. Glenn W. Brier proposed it in 1950 to grade weather forecasts (Brier, Monthly Weather Review). For yes/no questions, you take the difference between your forecast and what happened (1 if YES, 0 if NO), square it, and average over all your forecasts. The result runs from 0 to 1 in the common version, and lower is better.
A worked example with three forecasts:
| Forecast of YES | Outcome | Calculation | Score |
|---|---|---|---|
| 80% | YES (1) | (0.8 - 1)² = 0.04 | 0.04 |
| 60% | NO (0) | (0.6 - 0)² = 0.36 | 0.36 |
| 30% | NO (0) | (0.3 - 0)² = 0.09 | 0.09 |
The average is (0.04 + 0.36 + 0.09) / 3 = 0.163. For comparison, answering 50% every time scores exactly 0.25 whatever happens, so 0.163 beats the "I have no idea" baseline. A perfect forecaster scores 0, and someone who is confidently wrong every time scores 1.
Notice what the score punishes. A confident miss (90% on something that doesn't happen) costs 0.81, while a hedge at 60% costs 0.36. That's the point: it rewards honest uncertainty and penalizes bluster.
Don't obsess over one number, though. The Brier score depends on how hard the questions were, so compare it to a baseline (like 50%, or the market price) rather than to a friend who forecast different questions.
Why Keep a Prediction Record?
Memory is generous to us. We remember the calls we got right and quietly forget the ones we didn't, a pattern called hindsight bias: after the fact, outcomes feel like they were obvious.
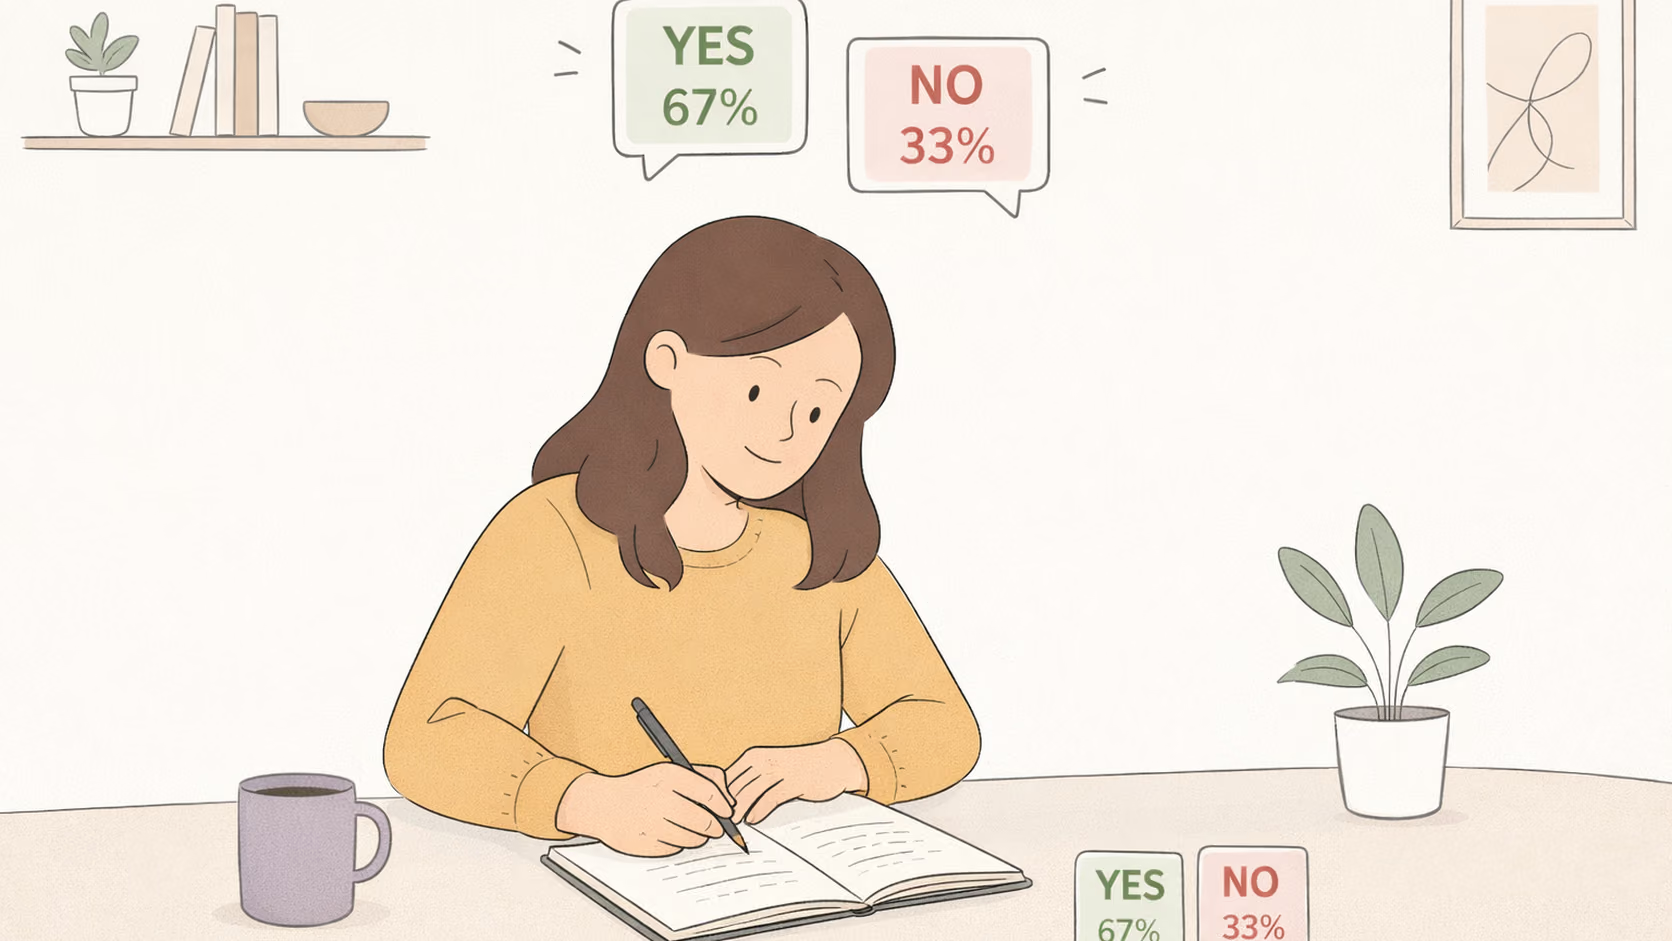
A written record fixes this. For each prediction, note four things: the question and its resolution rules, your probability, the date, and a one-line reason. When the result is known, add the outcome. After 20 or 30 predictions, review them: Are your 80% calls landing 80% of the time? Which topics are you weakest on? Which reasons turned out to be wrong?
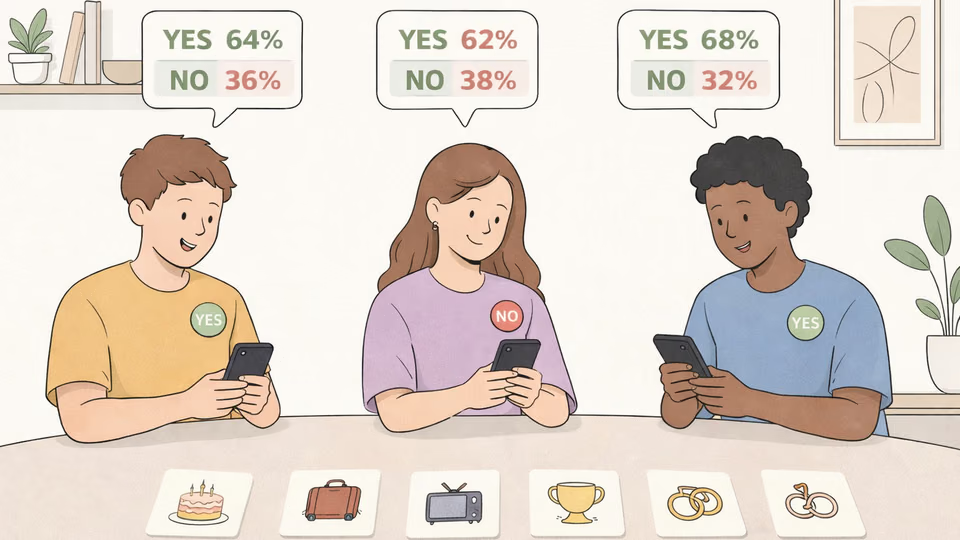
A good question makes this far easier. If it is vague ("Will the economy do well?"), you can't score it. Our guide to writing a question with a clear date and a clear way to settle it covers the details. And if you want a friend to hold you to your predictions, there is a kind way to use predictions to keep each other accountable.
How Does Combining Opinions Help Your Own Forecasts?
One more habit from the research: don't rely on a single viewpoint, including your own. Averaging several independent estimates usually beats picking one. This is the idea behind the wisdom of the crowd, and it works at small scale too. Even a rough second opinion from a friend who disagrees can pull your number toward reality.
A related trick is to argue the other side before you commit. Write two sentences on why you might be wrong. If you can't, you probably haven't thought about it enough.
How Can You Practice Forecasting on KrowdCall?
Practice needs fast feedback, and a prediction market supplies it: you state a number, other people state theirs, and the market resolves on a date you can't argue with. On KrowdCall the price shows the group's live probability, so you can compare your own estimate with it before you act, and your trade history and profit and loss report keep the record for you.
A simple training loop:
- Pick an open market and write your probability before looking at the price.
- Compare it with the market. If you differ, write down why.
- Make a prediction only if your estimate is meaningfully above or below the price.
- When the market resolves, check your result in your trade history and profit and loss report.
- Every month, review which of your reasons held up.
You can browse open markets to start, or create your own question and share the invite link with a few friends. Having people who disagree with you is half the value, and how to run recurring rounds with your friends has ideas for leagues and repeat questions. Free Coins are enough to make people think twice: the real reward is a record you can look back on.
So What Should You Do First?
If you only change one thing, write your next prediction down as a probability, with a date and a reason, and look at it again when the answer comes in. Everything else on this list builds on that habit.
Better forecasting isn't about being right more often in a flashy way. It's about being honest on the scale: saying 70% when you mean 70%, moving when the evidence moves, and noticing when you were wrong. Do that for a few months, and you will probably find your numbers, and your arguments with friends, get a lot more interesting.
Frequently asked questions
Find quick answers to the most common questions about this topic.
Start from the base rate, give your answer as a probability instead of a yes or no, update in small steps when you learn something new, and keep a written record. Scoring your forecasts afterwards, for example with the Brier score, shows where you are over- or under-confident.

Author
BrumaReady to test your predictions?
Put your foresight to the test. Create your first prediction market in seconds — completely free, with no real money involved.